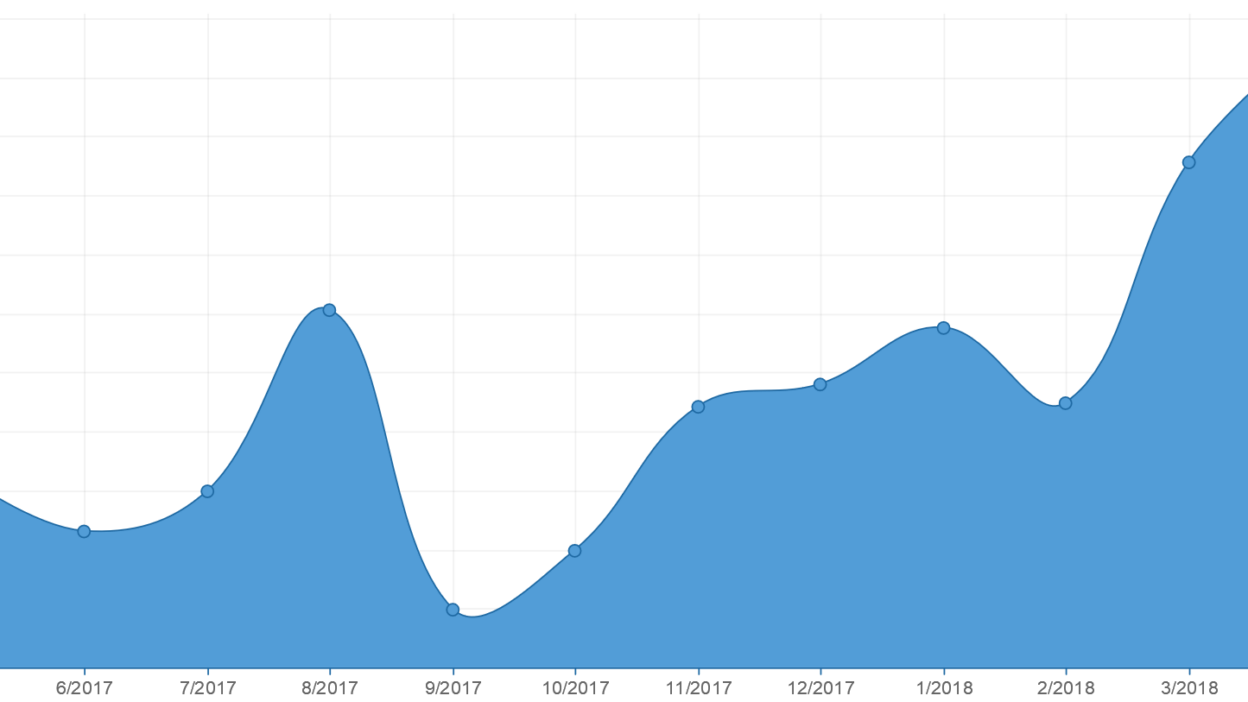
Here are some details culled from the YouMail robocall index for April, 2018.
- There was an estimated 3.36 billion robocalls placed in April 2018, a 6.5% month-on-month increase in robocall volume, and a 34.4% increase vs. April of last year.
- The 3.36 billion robocalls set a new record for the second month in a row, and was only the second time we’ve seen 3 billion robocalls in a single month.
- April’s robocall volume amounted to approximately 1,297 robocalls placed every second or 112.0 million calls per day during the month, both records, and a roughly 10% increase from last month’s national robocall volume amounted to 1,178 robocalls placed every second, or 101.8 million per day.
Below are a variety of different breakdowns of robocall volumes by time, geographic regions, and more.
Inbound Robocalls
Overall Volume By Time Period
| Last 13 Months | /Month | /Day | /Hour | /Minute | /Second |
| APR 2018 | 3,361,051,800 | 112,035,060 | 4,668,128 | 77,802 | 1,297 |
| MAR 2018 | 3,155,805,700 | 101,800,184 | 4,241,674 | 70,695 | 1,178 |
| FEB 2018 | 2,747,768,500 | 98,134,589 | 4,088,941 | 68,149 | 1,136 |
| JAN 2018 | 2,875,169,300 | 92,747,397 | 3,864,475 | 64,408 | 1,073 |
| DEC 2017 | 2,779,456,500 | 89,659,887 | 3,735,829 | 62,264 | 1,038 |
| NOV 2017 | 2,741,568,726 | 88,437,701 | 3,684,904 | 61,415 | 1,024 |
| OCT 2017 | 2,497,627,000 | 80,568,613 | 3,357,026 | 55,950 | 933 |
| SEP 2017 | 2,397,740,500 | 79,924,683 | 3,330,195 | 55,503 | 925 |
| AUG 2017 | 2,905,398,500 | 93,722,532 | 3,905,106 | 65,085 | 1,085 |
| JUL 2017 | 2,598,363,500 | 86,612,117 | 3,608,838 | 60,147 | 1,002 |
| JUN 2017 | 2,530,355,000 | 84,345,167 | 3,514,382 | 58,573 | 976 |
| MAY 2017 | 2,624,923,500 | 84,674,952 | 3,528,123 | 58,802 | 980 |
| APR 2017 | 2,500,833,000 | 83,361,100 | 3,473,379 | 57,890 | 965 |
The Top 50 Cities
| Rank | City-Area | Est. Calls Rec. | Change (M:M) | % Chg. | Last Rank | Rank Chg. |
| 1 | Atlanta, GA | 147,923,200 | 9,787,400 | 7% | 1 | NC |
| 2 | Dallas, TX | 127,500,800 | 6,534,800 | 5% | 3 | +1 |
| 3 | New York, NY | 122,671,000 | -330,400 | 0% | 2 | -1 |
| 4 | Los Angeles, CA | 122,362,800 | 12,587,700 | 11% | 5 | +1 |
| 5 | Chicago, IL | 120,092,000 | 8,275,600 | 7% | 4 | -1 |
| 6 | Houston, TX | 103,548,300 | 5,170,100 | 5% | 6 | NC |
| 7 | Baltimore, MD | 79,021,100 | 3,746,800 | 5% | 7 | NC |
| 8 | Philadelphia, PA | 60,969,300 | 3,976,300 | 7% | 9 | +1 |
| 9 | San Francisco Bay Area, CA | 60,737,800 | 3,844,200 | 7% | 10 | +1 |
| 10 | Newark, NJ | 60,585,700 | -903,400 | -1% | 8 | -2 |
| 11 | Phoenix, AZ | 60,016,100 | 4,493,400 | 8% | 11 | NC |
| 12 | Detroit, MI | 56,533,900 | 3,061,000 | 6% | 12 | NC |
| 13 | Miami, FL | 46,314,800 | 2,141,800 | 5% | 13 | NC |
| 14 | Ft. Lauderdale, FL | 43,569,100 | 4,158,500 | 11% | 14 | NC |
| 15 | Riverside, CA | 41,572,900 | 5,237,500 | 14% | 15 | NC |
| 16 | San Diego, CA | 40,829,700 | 4,756,800 | 13% | 16 | NC |
| 17 | Tampa, FL | 36,704,300 | 2,806,600 | 8% | 17 | NC |
| 18 | Seattle, WA | 33,208,500 | 2,382,800 | 8% | 18 | NC |
| 19 | Birmingham, AL | 31,533,200 | 1,218,500 | 4% | 19 | NC |
| 20 | New Orleans, LA | 31,351,700 | 1,274,300 | 4% | 20 | NC |
| 21 | Denver, CO | 30,356,500 | 1,448,700 | 5% | 21 | NC |
| 22 | Memphis, TN | 29,739,500 | 1,935,100 | 7% | 22 | NC |
| 23 | Charlotte, NC | 29,362,900 | 3,150,500 | 12% | 27 | +4 |
| 24 | Las Vegas, NV | 29,107,800 | 2,207,200 | 8% | 26 | +2 |
| 25 | Cleveland, OH | 29,024,700 | 1,318,300 | 5% | 23 | -2 |
| 26 | Orlando, FL | 28,730,600 | 1,224,300 | 4% | 25 | -1 |
| 27 | Baton Rouge, LA | 27,953,200 | 264,000 | 1% | 24 | -3 |
| 28 | Alexandria, VA | 27,162,100 | 1,504,900 | 6% | 28 | NC |
| 29 | Fresno, CA | 26,903,300 | 2,611,500 | 11% | 33 | +4 |
| 30 | Sacramento, CA | 26,339,500 | 1,386,000 | 6% | 29 | -1 |
| 31 | Buffalo, NY | 26,283,200 | 1,491,100 | 6% | 30 | -1 |
| 32 | Columbia, SC | 26,026,500 | 2,959,200 | 13% | 40 | +8 |
| 33 | Augusta, GA | 25,864,000 | 1,491,000 | 6% | 32 | -1 |
| 34 | Bakersfield, CA | 25,596,700 | 2,371,200 | 10% | 37 | +3 |
| 35 | Columbus, OH | 25,162,300 | 1,959,400 | 8% | 38 | +3 |
| 36 | Boston, MA | 25,095,400 | 311,400 | 1% | 31 | -5 |
| 37 | St. Louis, MO | 24,959,200 | 1,473,300 | 6% | 36 | -1 |
| 38 | Indianapolis, IN | 24,899,200 | 2,521,100 | 11% | 41 | +3 |
| 39 | Raleigh, NC | 24,624,200 | 1,432,100 | 6% | 39 | NC |
| 40 | Charleston, SC | 24,501,100 | 2,538,300 | 12% | 44 | +4 |
| 41 | San Antonio, TX | 24,314,900 | 678,400 | 3% | 35 | -6 |
| 42 | Minneapolis, MN | 23,989,200 | 1,744,000 | 8% | 43 | +1 |
| 43 | Virginia Peninsula | 23,728,400 | 1,429,400 | 6% | 42 | -1 |
| 44 | Camden, NJ | 23,695,300 | -531,400 | -2% | 34 | -10 |
| 45 | Washington, DC | 23,061,400 | 1,899,700 | 9% | 46 | +1 |
| 46 | Long Beach, CA | 22,316,100 | 3,117,000 | 16% | 53 | +7 |
| 47 | Nashville, TN | 22,315,000 | 1,082,800 | 5% | 45 | -2 |
| 48 | West Palm Beach, FL | 21,910,000 | 1,018,900 | 5% | 47 | -1 |
| 49 | Austin, TX | 21,835,800 | 1,403,100 | 7% | 51 | +2 |
| 50 | Pittsburgh, PA | 21,601,200 | 893,000 | 4% | 50 | NC |
The Top 20 Most-Robocalled Area Codes
| Rank | Area Code | City-Area | Est. Calls Received |
| 1 | 404 | Atlanta, GA | 67,417,400 |
| 2 | 832 | Houston, TX | 49,339,300 |
| 3 | 214 | Dallas, TX | 48,983,200 |
| 4 | 678 | Atlanta, GA | 45,378,500 |
| 5 | 954 | Ft. Lauderdale, FL | 40,758,700 |
| 6 | 917 | New York, NY | 39,428,400 |
| 7 | 310 | Los Angeles, CA | 37,226,100 |
| 8 | 773 | Chicago, IL | 35,841,600 |
| 9 | 817 | Dallas, TX | 34,073,200 |
| 10 | 347 | New York, NY | 32,790,800 |
| 11 | 205 | Birmingham, AL | 31,533,200 |
| 12 | 770 | Atlanta, GA | 30,559,500 |
| 13 | 901 | Memphis, TN | 29,739,500 |
| 14 | 704 | Charlotte, NC | 29,362,900 |
| 15 | 702 | Las Vegas, NV | 28,961,000 |
| 16 | 407 | Orlando, FL | 28,730,600 |
| 17 | 305 | Miami, FL | 28,511,300 |
| 18 | 225 | Baton Rouge, LA | 27,953,200 |
| 19 | 713 | Houston, TX | 26,553,000 |
| 20 | 281 | Houston, TX | 26,164,800 |
Top 40 Most Robocalled Area Codes Per Capita
| Rank | Area Code | Location | Est. Calls | Population | PerCapita/mo | PerCapita/dy |
| 1 | 404 | Atlanta, GA | 67,417,400 | 1,222,904 | 55.13 | 1.97 |
| 2 | 202 | Washington, DC | 23,061,400 | 566,825 | 40.69 | 1.45 |
| 3 | 225 | Baton Rouge, LA | 27,953,200 | 724,568 | 38.58 | 1.38 |
| 4 | 901 | Memphis, TN | 29,739,500 | 1,132,183 | 26.27 | 0.94 |
| 5 | 954 | Ft. Lauderdale, FL | 40,758,700 | 1,623,018 | 25.11 | 0.90 |
| 6 | 347 | New York, NY | 32,790,800 | 1,330,503 | 24.65 | 0.88 |
| 7 | 571 | Alexandria, VA | 8,753,700 | 369,555 | 23.69 | 0.85 |
| 8 | 478 | Macon, GA | 13,920,600 | 596,828 | 23.32 | 0.83 |
| 9 | 205 | Birmingham, AL | 31,533,200 | 1,383,851 | 22.79 | 0.81 |
| 10 | 504 | New Orleans, LA | 21,827,900 | 1,012,591 | 21.56 | 0.77 |
| 11 | 501 | Little Rock, AR | 18,058,600 | 845,870 | 21.35 | 0.76 |
| 12 | 214 | Dallas, TX | 48,983,200 | 2,321,856 | 21.10 | 0.75 |
| 13 | 702 | Las Vegas, NV | 28,961,000 | 1,373,034 | 21.09 | 0.75 |
| 14 | 337 | Lafayette, LA | 18,111,800 | 884,317 | 20.48 | 0.73 |
| 15 | 813 | Tampa, FL | 23,267,600 | 1,156,225 | 20.12 | 0.72 |
| 16 | 407 | Orlando, FL | 28,730,600 | 1,440,840 | 19.94 | 0.71 |
| 17 | 229 | Albany, GA | 11,177,000 | 579,377 | 19.29 | 0.69 |
| 18 | 240 | Baltimore, MD | 20,642,900 | 1,075,439 | 19.19 | 0.69 |
| 19 | 216 | Cleveland, OH | 19,955,900 | 1,083,871 | 18.41 | 0.66 |
| 20 | 803 | Columbia, SC | 26,026,500 | 1,414,765 | 18.40 | 0.66 |
| 21 | 843 | Charleston, SC | 24,501,100 | 1,356,134 | 18.07 | 0.65 |
| 22 | 704 | Charlotte, NC | 29,362,900 | 1,647,911 | 17.82 | 0.64 |
| 23 | 832 | Houston, TX | 49,339,300 | 2,791,665 | 17.67 | 0.63 |
| 24 | 561 | West Palm Beach, FL | 21,910,000 | 1,241,766 | 17.64 | 0.63 |
| 25 | 318 | Shreveport, LA | 20,168,400 | 1,143,157 | 17.64 | 0.63 |
| 26 | 817 | Dallas, TX | 34,073,200 | 1,934,508 | 17.61 | 0.63 |
| 27 | 210 | San Antonio, TX | 24,314,900 | 1,390,662 | 17.48 | 0.62 |
| 28 | 251 | Mobile, AL | 11,176,400 | 650,094 | 17.19 | 0.61 |
| 29 | 912 | Savannah, GA | 14,699,100 | 855,707 | 17.18 | 0.61 |
| 30 | 334 | Montgomery, AL | 18,552,500 | 1,080,475 | 17.17 | 0.61 |
| 31 | 919 | Raleigh, NC | 24,407,500 | 1,447,521 | 16.86 | 0.60 |
| 32 | 512 | Austin, TX | 21,460,800 | 1,293,661 | 16.59 | 0.59 |
| 33 | 314 | St. Louis, MO | 20,795,900 | 1,258,594 | 16.52 | 0.59 |
| 34 | 615 | Nashville, TN | 22,173,000 | 1,362,222 | 16.28 | 0.58 |
| 35 | 917 | New York, NY | 39,428,400 | 2,459,156 | 16.03 | 0.57 |
| 36 | 267 | Philadelphia, PA | 19,965,900 | 1,308,769 | 15.26 | 0.54 |
| 37 | 706 | Augusta, GA | 25,429,500 | 1,687,230 | 15.07 | 0.54 |
| 38 | 313 | Detroit, MI | 23,782,000 | 1,580,054 | 15.05 | 0.54 |
| 39 | 904 | Jacksonville, FL | 20,754,900 | 1,383,389 | 15.00 | 0.54 |
| 40 | 757 | Virginia Peninsula | 23,728,400 | 1,590,549 | 14.92 | 0.53 |
Top 20 Most Robocalled States by Volume
| Rank | State | Est. Calls Received |
| 1 | California | 384,426,000 |
| 2 | Texas | 363,314,600 |
| 3 | Florida | 261,156,200 |
| 4 | Georgia | 213,583,900 |
| 5 | New York | 207,808,900 |
| 6 | Illinois | 134,589,600 |
| 7 | Ohio | 115,757,000 |
| 8 | Pennsylvania | 115,429,200 |
| 9 | North Carolina | 111,030,700 |
| 10 | Louisiana | 97,585,100 |
| 11 | Michigan | 89,723,000 |
| 12 | Tennessee | 88,305,400 |
| 13 | New Jersey | 84,281,000 |
| 14 | Virginia | 82,981,800 |
| 15 | Maryland | 79,021,100 |
| 16 | Alabama | 77,855,800 |
| 17 | South Carolina | 64,396,600 |
| 18 | Arizona | 60,016,100 |
| 19 | Missouri | 51,740,500 |
| 20 | Indiana | 51,408,100 |
Outbound Robocalls
Top 20 Robocalling Numbers by Volume
| Rank | Robocaller | Est. Calls Placed | Type of Caller | Caller |
| 1 | 8009556600 | 37,777,800 | Bank Debt Collector | Capital One |
| 2 | 9802423698 | 22,307,100 | Other | Prescription Approval Request |
| 3 | 7732736136 | 21,106,300 | Other | Health Insurance Spam |
| 4 | 9738540915 | 14,144,700 | Debt Collector | Portfolio Recovery Assoc. |
| 5 | 8776478552 | 13,961,100 | Bank Debt Collector | Wells Fargo |
| 6 | 5172191107 | 13,521,400 | Debt Collector | Portfolio Recovery Assoc. |
| 7 | 8882224227 | 11,590,900 | Bank Debt Collector | Santander USA |
| 8 | 8002662278 | 11,210,600 | Cable Debt Collector | Comcast |
| 9 | 9543694797 | 11,178,000 | Debt Collector | Portfolio Recovery Assoc. |
| 10 | 7033486954 | 10,356,400 | Other | Health Insurance Spam |
| 11 | 8009423767 | 9,071,900 | Other | Substitute Teacher Notification |
| 12 | 8443496207 | 8,540,100 | Retail Debt Collector | Fingerhut |
| 13 | 8009475096 | 7,778,000 | Telephone Company | AT&T |
| 14 | 8442137851 | 6,966,300 | Bank Debt Collector | Wells Fargo Home Mortg. |
| 15 | 8666523145 | 6,632,900 | Debt Collector | Encore Receivable Mgt. |
| 16 | 8664084070 | 6,085,300 | Bank Debt Collector | Barclay’s Bank |
| 17 | 8002927508 | 5,851,800 | Bank Debt Collector | Synchrony Bank |
| 18 | 8008165569 | 5,610,800 | Debt Collector | TSI |
| 19 | 8008755164 | 5,562,500 | Retail Debt Collector | ERC |
| 20 | 8002898004 | 5,520,900 | Bank Debt Collector | Wells Fargo Dealer Svs. |
Top 20 Cities that Made the Most Robocalls
| Rank | City | Est. Calls Placed | ||
| 1 | Chicago, IL | 106,508,800 | ||
| 2 | Los Angeles, CA | 93,550,400 | ||
| 3 | New York, NY | 85,781,400 | ||
| 4 | Dallas, TX | 81,696,200 | ||
| 5 | Newark, NJ | 70,945,000 | ||
| 6 | Atlanta, GA | 67,340,100 | ||
| 7 | Houston, TX | 60,717,900 | ||
| 8 | Phoenix, AZ | 57,008,100 | ||
| 9 | Seattle, WA | 52,539,900 | ||
| 10 | San Francisco Bay Area, CA | 45,739,400 | ||
| 11 | Charlotte, NC | 43,943,000 | ||
| 12 | Philadelphia, PA |
|
||
| 13 | Detroit, MI | 40,232,300 | ||
| 14 | Baltimore, MD | 39,935,800 | ||
| 15 | Ft. Lauderdale, FL | 39,166,200 | ||
| 16 | Washington, DC | 38,861,600 | ||
| 17 | Columbus, OH | 35,871,600 | ||
| 18 | Orlando, FL | 34,641,300 | ||
| 19 | Miami, FL | 31,900,100 | ||
| 20 | San Diego, CA | 30,119,200 |
Top 20 States That Made The Most Robocalls
| Rank | State | Est. Calls Placed |
| 1 | California | 275,316,100 |
| 2 | Texas | 234,635,600 |
| 3 | Florida | 201,895,300 |
| 4 | New York | 159,051,500 |
| 5 | Illinois | 112,941,800 |
| 6 | Georgia | 100,173,400 |
| 7 | Ohio | 97,308,800 |
| 8 | New Jersey | 82,136,100 |
| 9 | North Carolina | 76,604,400 |
| 10 | Michigan | 70,063,700 |
| 11 | Pennsylvania | 64,935,300 |
| 12 | Arizona | 57,008,100 |
| 13 | Washington | 55,065,000 |
| 14 | Virginia | 53,303,500 |
| 15 | Tennessee | 47,928,900 |
| 16 | Maryland | 39,935,800 |
| 17 | District of Columbia | 38,861,600 |
| 18 | Louisiana | 37,198,300 |
| 19 | Colorado | 36,811,400 |
| 20 | Alabama | 36,402,600 |
Top Area Codes That Made The Most Outbound Robocalls (non Toll Free)
| Rank | Area code | City-Area | Est. Calls Placed | |
| 1 | 202 | Washington, DC | 38,861,600 | |
| 2 | 773 | Chicago, IL | 32,542,400 | |
| 3 | 614 | Columbus, OH | 31,697,200 | |
| 4 | 312 | Chicago, IL | 30,463,500 | |
| 5 | 954 | Ft. Lauderdale, FL | 30,323,100 | |
| 6 | 980 | Charlotte, NC | 30,028,300 | |
| 7 | 210 | San Antonio, TX | 28,219,300 | |
| 8 | 469 | Dallas, TX | 25,033,800 | |
| 9 | 678 | Atlanta, GA | 24,686,700 | |
| 10 | 972 | Dallas, TX | 22,936,800 | |
| 11 | 407 | Orlando, FL | 22,404,600 | |
| 12 | 646 | New York, NY | 21,286,300 | |
| 13 | 513 | Cincinnati, OH | 21,230,700 | |
| 14 | 973 | Newark, NJ | 20,670,500 | |
| 15 | 480 | Phoenix, AZ | 20,616,900 | |
| 16 | 201 | Newark, NJ | 20,387,800 | |
| 17 | 702 | Las Vegas, NV | 20,288,500 | |
| 18 | 215 | Philadelphia, PA | 20,285,600 | |
| 19 | 425 | Seattle, WA | 20,225,200 | |
| 20 | 703 | Alexandria, VA | 20,053,400 |
Details on the Top 12 Most Robocalled Cities in America
#1 Atlanta
- Atlanta topped the YouMail 50 Most Robocalled Cities in America™ list for the 29th month in a row, with its residents receiving nearly 147.9 million robocalls in April.
- Atlanta’s 404 area code also topped the list of most-robocalled area codes on a per-capita basis for the 29th month in a row, with 55.1 robocalls per person in the month of April. This translated to 1.97 robocalls per person per day.
- Atlanta’s 404 area code received the most robocalls of any area in April (approximately 67.4 million) and Three Atlanta area codes (404, 678, and 770) made the list of 20 Most-Robocalled Area codes in the month of April.
- Atlanta finished #6 on the list of cities that made the most robocalls in April (67.3 million).
- Atlanta’s 678 area code finished #9 on the list of most-prolific robocalling areas in the nation, placing nearly 24.7 million robocalls in April.
#2 Dallas
- Dallas was the second most-robocalled city in America in April with 127.5 million robocalls received.
- Two Dallas area codes (214 and 817) made the list of 20 Most-Robocalled Area codes in the month of April, finishing #3 and #9 on the list, respectively. Dallas’ 214 area code finished #12 on the list of most robocalled are codes per capita with 21.1 robocalls received per person during the month.
- Dallas finished #4 on the list of cities that made the most robocalls in April (nearly 81.7 million robocalls placed).
- Two Dallas area codes 469 and 972 made the list of 20 most-prolific robocalling areas in April. The two areas (which finished #8 and #10 on the list, respectively) produced a combined 47.9 million robocalls in April.
#3 New York
- New York was #3, with nearly 122.6 million robocalls received.
- Two New York area codes (917 and 347) placed on the list of 20 most-robocalled area codes for the month of April. Residents of the 917 area received 39.4 million calls in April, while the 347 area received nearly 32.8 million robocalls during the month.
- New York’s 347 area code finished #6 on the list of areas that received the most robocalls in April on a per-capita basis. New Yorkers in the 347 area code received nearly 25 calls per person during the month.
- The city of New York finished #3 on the list of cities that placed the most robocalls in April, responsible for 85.7 million outbound robocalls during the month.
- New York’s 646 area code placed #12 on the list of areas that placed the most robocalls during the month with 21.3 million calls placed.
#4 Los Angeles
- Los Angeles placed#4, with its residents receiving 122.3 million robocalls.
- Los Angeles’ 310 area code finished #7 on the list of most-robocalled area codes in April with 37.2 million robocalls received.
- Los Angeles placed second on the list of cities that made the most robocalls in April (93.5 million.
#5 Chicago
- Chicago was the 5th most-prolific robocalling city in America during the month of April with 106.5 million robocalls placed.
- Chicago’s 773 area code was the eighth-most robocalled area code in America during the month of April. Residents there received a combined 35.8 million robocalls during the month of April.
- Chicago’s 773 and 312 area codes finished #2 and #4, respectively, on the list most-prolific robocalling area codes in the month of April. These two area codes combined for 62.9 million outbound robocalls during the month.
#6 Houston
- Houston placed #6, receiving 103.5 million calls, a 5% increase vs. March, with residents receiving nearly 18 robocalls per person during the month.
- Three Houston area codes 832, 713 and 281, ranked #2, #19 and #20, respectively, on the list of areas that received the most robocalls during the month of April.
- Houston finished #7 on the list of cities that made the most robocalls during the month of April (60.7 million).
- Houston area code 832 finished 23rd on the list of area codes receiving the most robocalls on a per-capita basis.
#7 Baltimore
- Baltimore remained at #7, with an estimated 79.0 million robocalls received.
- Baltimore finished #14 on the list of cities that placed the most robocalls in April with 39.9 million robocalls placed.
- Baltimore’s 240 area code received 19.2 calls per person in April, making it the 18th most-robocalled area on a per-capita basis.
#8 Philadelphia
- Philadelphia placed #8, as it received approximately 60.9 million robocalls for the month, fueled by a 7% increase in robocall volume vs. the previous month. Residents received an estimated 15.2 robocalls per person during the month of April.
- Philadelphia claimed the #12 spot on the list of cities that placed the most robocalls in April with 40.9 million calls placed.
- Philadelphia’s 215 area code placed #18 on the list of area codes that placed the most robocalls in April (nearly 20.3 million robocalls placed), and the 267 area code placed #36 on the list of most-robocalled areas on a per-capita basis.
#9 San Francisco Bay Area
- The San Francisco Bay Area ranked #9, with nearly 60.7 million robocalls received in April – a 7% increase in calls received vs. March.
- San Francisco also claimed the #10 spot on the list of Top 20 cities that made the most robocalls in April, with 45.7 million calls placed.
#10 Newark, NJ
- Newark took the #10 spot, receiving nearly 60.5 million calls during the month.
- Newark moved up three spots to #5 on the list of cities that generated the most robocalls in April with 70.9 million calls placed, a 36.0% month-on-month increase.
- Breaking it down further, Newark’s 973 and 201 area codes finished #14 and #16, respectively, on the list of area codes that placed the most robocalls during the month of April. Combined, these area codes placed nearly 40.9 million robocalls during the month.
#11 Phoenix
- Phoenix placed #11, with nearly 60.0 million robocalls received in April, an increase of 8% vs. March.
- Phoenix claimed the #8 position on the list of cities that placed the most robocalls with 57.0 million robocalls made in April. Phoenix was one of nine cities to place more than 50 million robocalls in a single month.
- Phoenix’s 480 area code placed 20.6 million robocalls in April, which ranked #15 on the list of area codes that placed the most robocalls for the month.
#12 Detroit
- Detroit dropped to the #12 spot, with 56.5 million calls received (despite a 6% increase vs. March).
- Detroit’s 313 area code also finished #38 on the list of cities that received the most robocalls on a per-capita basis. Residents of this area code finished April having received an average of 15.0 robocalls per person during the month.
- Detroit claimed the #13 position on the list of cities that made the most robocalls in April with 40.2 million robocalls placed.


[…] of calls Abramovic oversaw sounds impressive, until you learn that last month alone there were 3.36 billion robocalls placed. Using those numbers, the monthly calls from Abramovic constitute less than 3% of the total […]
[…] of calls Abramovic oversaw sounds impressive, until you learn that last month alone there were 3.36 billion robocalls placed. Using those numbers, the monthly calls from Abramovic constitute less than 3% of the total […]
[…] of calls Abramovic oversaw sounds impressive, until you learn that last month alone there were 3.36 billion robocalls placed. Using those numbers, the monthly calls from Abramovic constitute less than 3% of the total […]
[…] month after both the House and the Senate held hearings on the surge of robocalling, which reached 3.36 billion unwanted calls in April, 2018, a 34 per cent increase from a year earlier, according to call management app maker […]
Numbers speak alone!